All simulations
Bell curves and fat tails
Compare the normal distribution with fat-tailed and skewed returns, and count the impossible days.
The center of the curve.
How spread out the days are.
Within 1σ (normal says 68%)68.6%
Within 2σ (normal says 95%)95.5%
Within 3σ (normal says 99.7%)99.8%
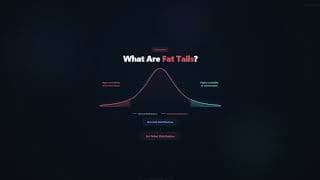
Two numbers describe this whole curve: a mean of 0.05% and a standard deviation of 1.00%. Of 5,000 simulated days, 68.6% land within one standard deviation, 95.5% within two and 99.8% within three. Under this model a move four or five standard deviations out is almost unbelievable.
Try this
- Check the 68–95–99.7 rule: do the three measured shares match what the normal distribution says?
- Raise the standard deviation. The center stays put, but the days swing around much more. That's what higher volatility means.
- Draw new days a few times. How often do you see anything in the coral bars beyond three standard deviations?
The math
- the mean, the center of the curve
- the standard deviation, or volatility
- how likely a return near x is